In a year that could easily be defined by a few different words — including but not limited to tariffs, technology, or more broadly, uncertainty — capital markets have plugged along splendidly. Despite a near-bear market correction in April, the S&P 500 and U.S. stocks more broadly have powered higher, hurdling obstacles nearly without interruption. The bond market has also done more than hold its own, while outside of markets, the American economy has displayed resilience as well amid a challenging backdrop. As 2025 nears its final 100 calendar days, market focus is already beginning to turn forward and attempt to reconcile what market drivers could remain in place, and what could change in the first year of the new half-decade. While not an exhaustive list, here’s some of our early keys to 2026.
Equities: Resilient Economy Bolstered by Fiscal Stimulus Could Help Corporate America Hit Lofty Earnings Targets
The U.S. economy will benefit from fiscal policy support in 2026, notably the One Big Beautiful Bill Act (OBBBA). This legislation is expected to boost corporate profits and help corporate America sustain mid-single-digit revenue growth, while artificial intelligence (AI)-driven efficiencies could help lift margins. Together, these factors underpin forecasts for double-digit earnings growth, which will likely be a primary driver of stock prices given limited room for expansion in the price-to-earnings ratio (P/E) which is still over 22, even after the 2% pullback in the S&P 500 since its late-October record closing high. Given elevated valuations, corporate America’s ability to hit double-digit earnings growth targets next year will be a key factor for stock market performance in 2026.
Hitting Lofty EPS Targets Will Be Key in 2026; It Won’t Be Easy
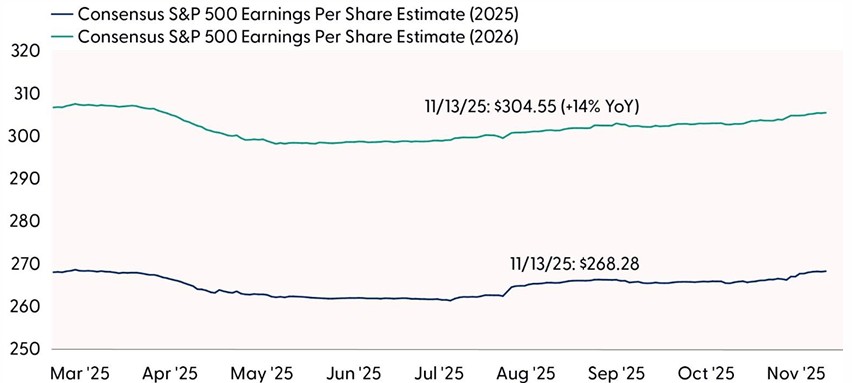
Source: LPL Research, FactSet 11/13/25
Disclosures: Indexes are unmanaged and cannot be invested in directly. Estimates are subject to change and may not materialize as predicted.
Equities: AI Investment Cycle Follow Through Needs to Justify Valuations
AI remains the most powerful force shaping markets. In 2026, the hyperscalers — including Alphabet (GOOG/L), Amazon (AMZN), Meta (META), Microsoft (MSFT), and Oracle (ORCL) — are expected to boost AI-related capital expenditures to nearly $520 billion — a 30% increase from 2025. This surge represents about 1.6% of U.S. gross domestic product (GDP), making AI spending a significant economic driver next year. These investments are expected to fuel productivity gains, enhance corporate profit margins, and potentially drive double-digit earnings growth for the S&P 500. The Magnificent Seven will likely continue to dominate earnings contributions, despite increasing investor scrutiny on these spending plans, though the gap between profit growth from mega cap tech and the broader market is poised to narrow. While AI enthusiasm remains strong, stretched valuations and execution challenges, particularly if some projects fail to deliver expected returns as hyperscaler cash flows dwindle, will be key risks to watch in 2026. AI’s transformative potential positions it as a cornerstone for equity gains in 2026, but also a potential obstacle given how reliant stocks are on this theme.
Equities: Stocks Like Luxury Rate Cuts, Making Monetary Policy Support Key For Stocks in 2026
The Federal Reserve’s (Fed) ongoing rate-cutting cycle, increasingly coming into question in recent days, is another critical driver for stocks in 2026. Unlike emergency cuts to stave off or mitigate recessions, rate cuts anticipated in 2026 will be aimed at normalizing policy to further the Fed’s efforts to get inflation down to its 2% target while supporting healthy job growth. Historically, stocks have fared well when the Fed has cut rates while stocks were near all-time highs — as was the case last month — and the economy avoids recession, as we expect it to this cycle. This dynamic suggests a favorable backdrop for risk assets, even though volatility around a potentially uneven path is to be expected. Overall, monetary policy looks set to remain a positive force for stocks in 2026.
In terms of risks stocks will face next year, lofty expectations for AI, reflected in stretched valuations, sit atop the list, while additional potential sources of market volatility include possible upward pressure on long-term interest rates, midterm election-year policy uncertainty, and U.S.-China trade tensions.
Economy: AI Adoption Rates on the Rise, Potentially Pressuring Labor Markets
Considering a Fed in the middle of an easing cycle — largely driven by cooling jobs data — the labor market will remain a focal point for investors in 2026. But recent job cuts data point to somewhat of a new consideration for the labor market heading into 2026: AI. As global labor arbitrage becomes less viable and access to cheap labor in emerging markets continues to narrow, businesses are increasingly turning to AI as a domestic solution for cost control and productivity gains. The recent spike in layoff announcements illustrates the pressure on businesses to curb costs, and it seems like businesses plan to increase AI adoption rates as they decrease headcount. Roughly 20% of October layoff announcements were attributed to AI alone. Overall, cost-cutting drove 33% of all layoff announcements. Interestingly, businesses are not reporting weaker economic conditions or slower sales as major reasons to announce layoffs.
Current AI adoption rates remain relatively low across several sectors, particularly in traditional industries like hotels, restaurants, and administration, despite the technology’s potential. Many firms are still in the early stages of experimentation, constrained by legacy systems, workforce readiness, and integration costs. This underutilization creates significant potential upside for the coming year as competitive pressures and cost-efficiency goals accelerate implementation. As AI tools become more accessible and regulatory frameworks clearer, we expect broader deployment in the economy, unlocking productivity gains and cutting labor costs.
AI Will Be a New Pillar of Growth
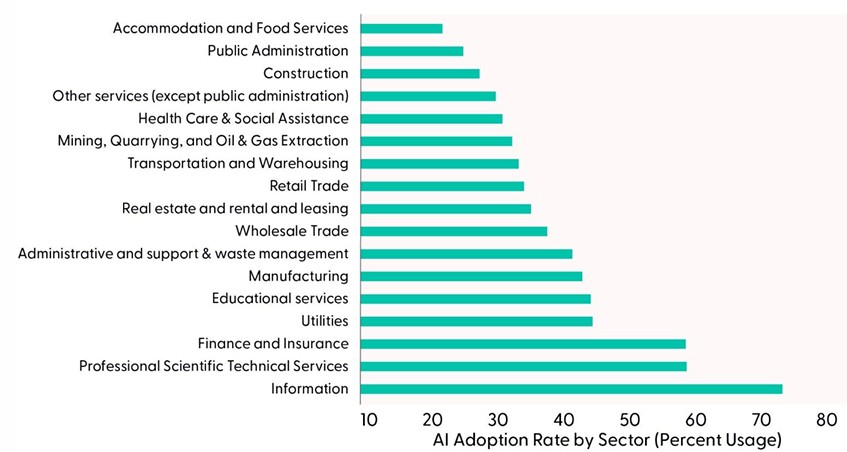
Source: LPL Research, Ramp Economics Lab 11/12/25
While data from Ramp Economics Lab suggests small and medium-sized firms have slowed the pace of AI adoption, this is unlikely to last for long. In the months before the government shutdown, the corporate sector was developing the economic outlook. It’s possible the temporary concerns about growth and inflation put a damper on adoption rates, but as the tailwinds to growth reemerge, we should expect renewed interest in protecting margins, preparing for expansion, and managing headcount through greater AI adoption. The number of AI products and services is growing, the ecosystem is maturing, and AI tools are becoming better aligned with the needs of businesses. The question “What’s your AI strategy?” is no longer just a buzzword, it’s a serious expectation from investors, executives, and advisors who now see long-term investment in AI as essential to scaling operations and staying competitive.
Fixed Income: Fed, Debt and Deficits, and Spreads to Remain in Focus
Heading into 2026, the Fed’s policy stance will be the dominant force shaping fixed income markets in general and Treasury yields in particular. With inflation easing but still above the 2% target, the Fed is expected to maintain a “slightly restrictive” posture rather than cutting aggressively. Current market pricing suggests the rate-cutting cycle could end by mid-2026, near 3%. A more accommodative stance — fed funds meaningfully below 3% — would be required for Treasury yields to fall notably from current levels. As such, an unexpected slowing of economic growth or further declines in inflation are needed to justify a more aggressive easing cycle.
Fiscal deficits and increasing debt issuance will likely also be, at times, notable drivers for Treasury yields in 2026. The U.S. government is expected to run fiscal deficits in the 6–7% range of GDP for the foreseeable future, so cost cutting initiatives (yeah right) and/or additional revenue sources could directionally impact yields. And while tariffs are a bad word in some circles, they are a welcome development for the Treasury market. With tariff collection expected to increase revenues/decrease deficits by $4 trillion over 10 years (per Congressional Budget Office estimates), the Treasury Department can scale back its bond issuance accordingly. This reduced supply of new Treasuries, all else equal, tends to support bond prices and can help contain yields. For a government managing substantial debt levels, this revenue diversification provides fiscal flexibility that markets generally view favorably.
Within credit markets, corporate credit spreads suggest that all is (generally) well in corporate America. Defaults, payment-in-kind issuance, and high-profile bankruptcies, such as Saks and New Fortress Energy, have picked up of late, potentially suggesting otherwise. And Zombie firms — those with interest costs exceeding income — further elevate idiosyncratic risk. Despite these challenges, systemic risk appears contained, but valuations are stretched: credit spreads remain near 20-year lows, offering limited compensation for growing risks. For credit spreads to remain tight, corporate America needs to continue to meet lofty expectations and the economy needs to stay out of a recession (we think it will).
Bottom line: A lot has been priced into fixed income markets already, so the interest rate environment will likely be the key driver of returns in 2026. And with a Fed expected to undergo compositional changes next year, the market’s bias may be toward lower yields. But with inflation still expected to be above the Fed’s 2% target, there is still a lot of uncertainty regarding how low the Fed can take the fed funds rate without disrupting inflation expectations, which remain anchored for now.
Technicals: Respecting the Uptrend, But Watching Rotation Dynamics
Volatility came back into U.S. equity markets last week as investors derisked across several crowded trades. Intraweek selling pressure was most pronounced in select mega cap names, retail favorites, profitless tech, heavily shorted stocks, and other pockets of high momentum. Hawkish commentary from Fed officials dampened rate-cut expectations and exacerbated Thursday’s decline. Fed funds futures now imply less than a 50% probability of a 0.25% cut next month, down from 66% last week.
By Friday, however, buy-the-dip sentiment had resurfaced as investors stepped in at key technical support. The S&P 500 survived another retest of its 50-day moving average (dma), which coincidentally overlaps with the lower end of its rising price channel. A break below this channel would expose downside risk toward the November and October lows (6,631 and 6,550, respectively).
While we remain respectful of the uptrend, the recent deterioration in market breadth and momentum is notable. The Relative Strength Index (RSI) — a momentum oscillator used to measure the velocity of price action to determine trend strength — has posted consecutive lower highs and deviated from price action, suggesting buyer fatigue may be setting in. Participation in the latest breakout to new highs has also been underwhelming. Fewer stocks remain above their 200-dma since August, and our trend model now shows more S&P 500 constituents in downtrends than uptrends for the first time since May. Important to note, diverging breadth can persist for extended periods, particularly in a mega-cap-driven market, but continued negative deviations between price and participation underscore rising concentration risk and structural fragility if key support levels fail.
Slowing Participation Hasn’t Stopped the S&P 500
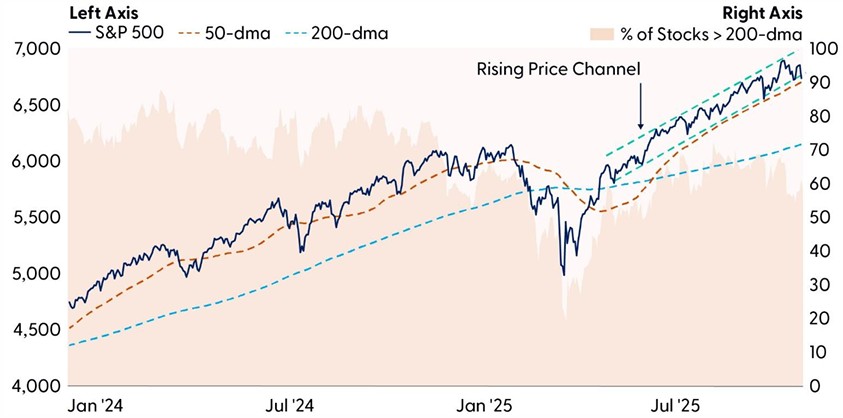
Source: LPL Research, Bloomberg 11/13/25
Disclosures: Past performance is no guarantee of future results. All indexes are unmanaged and can’t be invested in directly.
Leadership trends also warrant close attention as relative strength in more defensive areas of the market builds. This marks a potential character change in the risk-on recovery as comparable drawdowns since April did not translate into significant defensive rotations. While we haven’t witnessed full blown relative trend reversals toward sustainable defensive leadership, it highlights the first major sign of risk aversion in over six months.
Bottom line: We remain respectful of the S&P 500’s rising price channel. A breakdown below the November lows would raise the risk of a deeper pullback, potentially toward the October or even August lows, but not signal that the bull market is over.
Conclusion
As has often been the case in recent history, 2026 will be all about a transforming and evolving landscape for markets. Monetary policy and debt and deficit developments will remain in focus for bond investors, while stocks will likely continue their squabble with concentration risk and uneven participation. Simultaneously, impacts of the OBBBA will move toward top of mind as ongoing technology and AI advancement will continue to provide fresh catalysts for equities and the economy. Not to mention, Washington will return to center stage as midterm elections approach next November. These are just a few of our early keys to next year but look for more of our thoughts on 2026 in the upcoming release of our 2026 Outlook publication early next month.
Asset Allocation Insights
LPL’s Strategic and Tactical Asset Allocation Committee (STAAC) maintains its tactical neutral stance on equities. Investors may be well served by bracing for occasional bouts of volatility given how much optimism is reflected in stock valuations, but fundamentals remain broadly supportive. STAAC’s regional preferences across the U.S., developed international, and emerging markets (EM) are aligned with benchmarks. The Committee still favors growth over value and large caps over small caps.
Within fixed income, the STAAC holds a neutral weight in core bonds, with a slight preference for mortgage-backed securities (MBS) over investment-grade corporates. The Committee believes the risk-reward for core bond sectors (U.S. Treasury, agency MBS, investment-grade corporates) is more attractive than plus sectors. The Committee does not believe adding duration (interest rate sensitivity) at current levels is attractive and remains neutral relative to benchmarks.
Important Disclosures
This material is for general information only and is not intended to provide specific advice or recommendations for any individual. There is no assurance that the views or strategies discussed are suitable for all investors or will yield positive outcomes. Investing involves risks including possible loss of principal. Any economic forecasts set forth may not develop as predicted and are subject to change.
References to markets, asset classes, and sectors are generally regarding the corresponding market index. Indexes are unmanaged statistical composites and cannot be invested into directly. Index performance is not indicative of the performance of any investment and do not reflect fees, expenses, or sales charges. All performance referenced is historical and is no guarantee of future results.
Any company names noted herein are for educational purposes only and not an indication of trading intent or a solicitation of their products or services. LPL Financial doesn’t provide research on individual equities.
All information is believed to be from reliable sources; however, LPL Financial makes no representation as to its completeness or accuracy.
All investing involves risk, including possible loss of principal.
US Treasuries may be considered “safe haven” investments but do carry some degree of risk including interest rate, credit, and market risk. Bonds are subject to market and interest rate risk if sold prior to maturity. Bond values will decline as interest rates rise and bonds are subject to availability and change in price.
The Standard & Poor’s 500 Index (S&P500) is a capitalization-weighted index of 500 stocks designed to measure performance of the broad domestic economy through changes in the aggregate market value of 500 stocks representing all major industries.
The PE ratio (price-to-earnings ratio) is a measure of the price paid for a share relative to the annual net income or profit earned by the firm per share. It is a financial ratio used for valuation: a higher PE ratio means that investors are paying more for each unit of net income, so the stock is more expensive compared to one with lower PE ratio.
Earnings per share (EPS) is the portion of a company’s profit allocated to each outstanding share of common stock. EPS serves as an indicator of a company’s profitability. Earnings per share is generally considered to be the single most important variable in determining a share’s price. It is also a major component used to calculate the price-to-earnings valuation ratio.
All index data from FactSet or Bloomberg.
This research material has been prepared by LPL Financial LLC.
Not Insured by FDIC/NCUA or Any Other Government Agency | Not Bank/Credit Union Guaranteed | Not Bank/Credit Union Deposits or Obligations | May Lose Value
For public use.
Member FINRA/SIPC.
RES-0006316-1025 Tracking #826181 | #826665 (Exp. 11/26)