There was no shortage of headlines on both the micro and macro levels last week. Earnings season ramped up as nearly half of the S&P 500’s market cap reported third quarter (Q3) results, including a handful of mega cap companies. Monetary policy captured most of the economic spotlight as the Federal Reserve (Fed) delivered on expectations of another 0.25% interest rate cut and announced an end date to its quantitative tightening (QT) program. The European Central Bank (ECB) held rates for a third straight meeting and noted monetary policy is in a “good place,” while the Bank of Japan (BOJ) also kept rates unchanged as expected. Geopolitical headlines centered on the trade truce reached last week between the U.S. and China. While the agreement is temporary, it should help ease some tariff pressures and reduce the risk of further trade escalations between the world’s two largest economies.
Earnings Continue to Impress
The S&P 500 is over halfway through Q3 earnings season, and results have been impressive. Of the 318 companies that have reported results, 83% have surpassed earnings per share (EPS) estimates, notably above the 10-year average beat rate of 75%, according to FactSet. Growth has been supported by strong margins, which are running close to 13% this quarter. However, most of the attention last week was on capital expenditures (capex) reported by several of the mega cap stocks. Among these names, including Alphabet (GOOG/L), Amazon (AMZN), Apple (AAPL) Meta (META), and Microsoft (MSFT), the message of more spending on artificial intelligence (AI) infrastructure was clear as they collectively spent over $100 billion on capex in Q3. This number is only going to go up, based on guidance to increase spending on AI-related investments. As highlighted in the “Capital Expenditures Surge Across Big Tech” chart, capex among many of the mega cap names is expected to jump from around $400 billion in 2025 to $563 billion by 2027.
Capital Expenditures Surge Across Big Tech
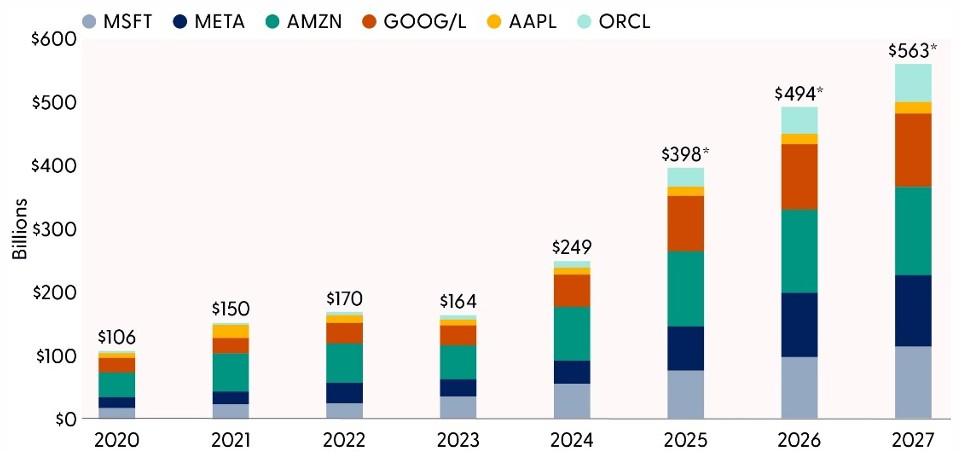
Source: LPL Research, Bloomberg 10/30/25
Disclosures: Past performance is no guarantee of future results. Any companies or options referenced are being presented as a proxy, not as a recommendation.
*Based on consensus estimates. Estimates may not materialize as predicted and are subject to change.
While investors have generally welcomed the increased spending during the so-called AI arms race, META faced a different market reaction after warning that capex growth “will be notably larger in 2026 than 2025” and that total expenses will grow at a “significantly faster” rate next year. Shares dropped 11% after reporting results, as the upward revision to spending (the third time this year) overshadowed an otherwise solid print for the company. This change in the market reaction points to investors placing increased scrutiny on expenses, especially when they are being supported by an increased debt load. Unlike some of its hyperscaler peers, META is also building its AI platform to support its core operations, rather than responding to customer demand like AMZN, MSFT, and GOOG/L. Given that these four hyperscalers are spending around 25% of revenue on capex, and that their capex is now significantly outpacing free cash flows, we suspect Wall Street may be transitioning to more of a “show me story” for return on investment of these massive capital outlays.
The Fed Delivers on Expectations
As widely expected, the Federal Reserve (Fed) cut interest rates by 0.25% at its October Federal Open Market Committee (FOMC) meeting last week. Similar to last month, the accompanying policy statement noted that economic activity has been expanding at a moderate pace, and the unemployment rate has remained low, despite rising downside risks to the labor market. With limited economic data available due to the ongoing government shutdown (outside of private sector data), there were few surprises in the press release. Recently appointed Fed Governor Stephen Miran dissented again, favoring a 0.50% interest rate cut, while Fed Governor Jeffrey Schmid preferred no change to the target range this month — a new dissenter since the September FOMC meeting (he voted in favor of a 0.25% cut last month). With its conflicting dissents, the Fed decision is reminiscent of September 2019, when the Committee cut rates, but some wanted a more aggressive cut, while others preferred no change at all. Remember that at that time, the economy was adjusting to the selective tariffs implemented during Trump 1.0. And incidentally, the committee implemented two more cuts later in 2019.
Policymakers also decided to end QT beginning December 1 — a policy that aims to tighten financial conditions by reducing the pace of reinvestment of proceeds from maturing bonds the Fed holds on its balance sheet, thereby reducing the money supply in the market. Ending QT was always part of the Fed’s plan, but signs of liquidity pressures over the last few weeks prompted policymakers to finally end balance sheet normalization.
Outside of the expected rate cut and the end of QT announcement, one of the biggest surprises was that a December rate cut is no guarantee. Speaking at the post-FOMC press conference, Fed Chair Jerome Powell stated, “Further reduction in the policy rate at the December meeting is not a foregone conclusion, far from it,” while further adding there were “strong differing views about how to proceed in December.” His statement caught the market off guard as it reduced visibility into future rate cuts and highlighted a growing divide among policymakers. For markets, reduced visibility usually means the potential for upside volatility risk, especially in the fixed income market.
The Fed Chair also noted that weakness in the labor market is not worsening. From the Fed’s view, the supply of workers has significantly decreased due to less immigration. At the same time, labor-force participation has slowed, suggesting less demand for new jobs as fewer people are seeking employment. He also noted the reduced supply in the labor market is running into a backdrop of less demand for hiring, aligning with the “no hire, no fire” theme characterizing the job market right now. From our perspective, the downside risks within the job market will likely ensure the Fed will continue to cut rates in December and throughout the next year. We’ve seen Powell sound hawkish at press conferences before, so investors should be focused on business signals, not the chair’s rhetoric.
On inflation, policymakers once again highlighted that pricing pressures remain elevated, with upside risk. Powell delineated between the disinflation trend in the services sector, especially housing, and a recent uptick in inflation for goods, an increase he attributed to tariffs rather than “broader inflationary pressures.” He further added that after stripping out the tariff impact on pricing pressures, inflation is not that far from the Fed’s 2% target.
The market expected a more dovish outcome. Treasury yields rose, stocks fell, and the dollar rose immediately after the press conference started. Furthermore, the fed funds futures market reduced expectations of a rate cut. As highlighted in the “Market Reprices Rate Cut Estimates Again” chart, the fed funds futures market is now pricing in only about a 30% probability of four rate cuts by December 2026. This was a notable downgrade from the day before the FOMC meeting, when the market priced in nearly 50% odds for five rate cuts by the end of next year.
Market Reprices Rate Cut Estimates Again
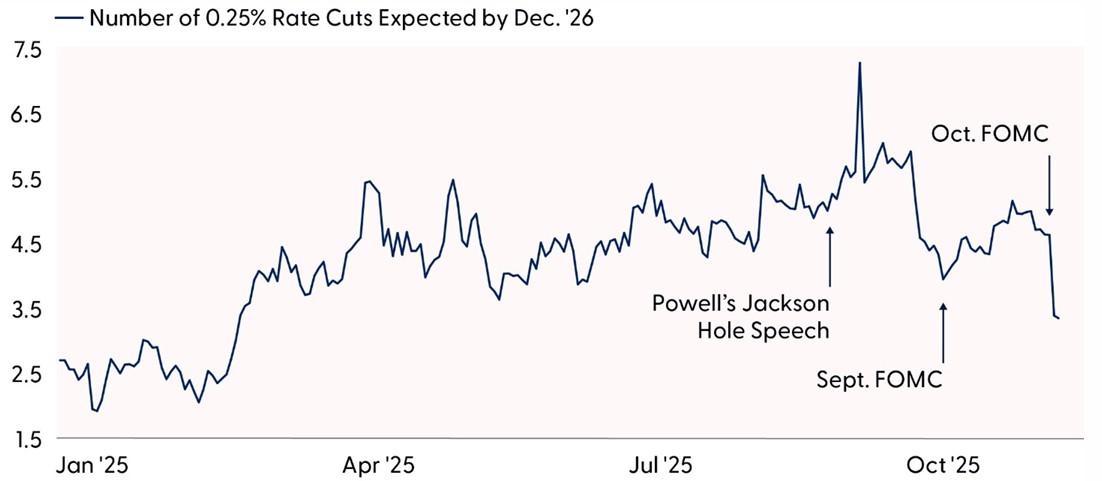
Source: LPL Research, Bloomberg 10/30/25
Disclosures: Past performance is no guarantee of future results.
Fixed Income Market Reaction
The repricing of rate cut estimates pushed yields higher across the Treasury curve. The 2-year Treasury yield, which is more sensitive to monetary policy than longer tenors, jumped around 12 basis points on the week, while 10-year Treasury yields rose around 10 basis points. Implied Treasury market volatility was more muted. The MOVE Index, a common measure of implied fixed income market volatility, with higher readings equating to higher expectations for 30-day Treasury market volatility and vice versa (like the VIX but for bonds), remained at multi-year lows last week. While the restarting of the rate-cutting cycle, limited economic data due to the shutdown, and seemingly less focus on the deficit is likely contributing to suppressed implied volatility, current levels on the MOVE Index are stretched to the downside. The MOVE Index’s current 66 reading is almost two standard deviations below its longer-term average and represents a historically low 28% discount to its 200-day moving average (dma). With volatility tending to mean-revert, an uptick in implied Treasury market volatility from here shouldn’t come as a surprise.
MOVE Index Drops to Multi-Year Lows
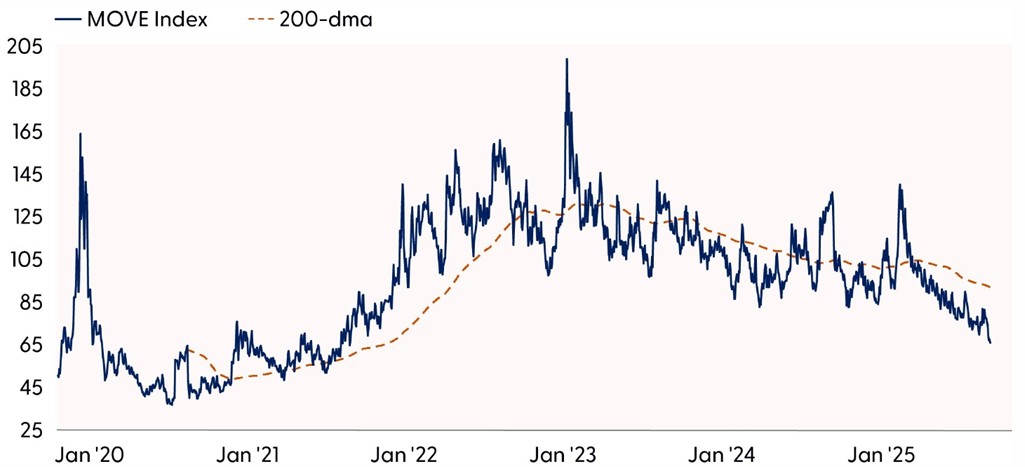
Source: LPL Research, Bloomberg 10/30/25
Disclosures: Past performance is no guarantee of future results. All indexes are unmanaged and can’t be invested in directly.
U.S.–China Trade Truce Eases Tariff Pressures
President Trump met with Chinese President Xi Jinping last week at the APEC summit in Gyeongju, South Korea — their first meeting since Trump’s return to office in January. The result: a one-year trade truce between the world’s two largest economies.
Key elements of the deal include a reduction in fentanyl-related tariffs from 20% to 10% and lowering the overall tariff rate on Chinese goods from 57% to approximately 47%. In return, China agreed to resume soybean purchases and pause rare-earth export controls for at least a year. The U.S. also rolled back expanded restrictions on Chinese firms and semiconductor exports.
This agreement follows a summer of heightened trade tensions, where fears of an overall 25% effective tariff rate loomed. However, recent deals — including a 10% tariff cut on South Korean goods — have significantly eased those concerns. Strategas Research now estimates the effective U.S. tariff rate will land around 13–14% at the high end.
More importantly, Treasury Department data shows that the actual tariff burden being paid currently is closer to 11%. While there may be a slight lag in full impact, corporate America has largely absorbed the pressure, with companies successfully managing margins despite these added costs.
With tariffs lower than initially feared, midyear earnings expectations — both ours and Wall Street’s — may have been overly cautious. The reduced tariff load is likely to support stronger-than-expected corporate earnings, contributing to the recent wave of positive earnings revisions.
A K-Shaped Rally
As the adage goes, don’t fight the tape, and we agree — it is hard to argue with a bull market making consistent new highs. However, another popular adage is that bull markets are not linear, although it certainly seems that way since April, with mostly one-way price action and limited drawdowns.
Applying technical analysis can help assess the health of a rally and identify potential soft spots that could signal pending downside risk. Market breadth metrics provide insight into what’s going on beneath the surface of the index by simply measuring how many stocks are supporting a price move. In general, a strong and durable rally is accompanied by broadening participation within an index, marked by a growing percentage of stocks advancing, reaching new highs, or trading above their key moving averages. When an index is moving higher, and market breadth measures are not keeping up, or even worse, deteriorating, it provides a warning sign of emerging cracks in the market’s foundation.
For the current rally, one of these cracks in market breadth has started to surface in the S&P 500’s Advance-Decline (A-D) line. For context, the A-D line is calculated by taking the difference between the number of advancing and declining stocks on the index for a given trading day and adding that difference to the prior day’s value. A rising A-D line indicates positive market breadth, as the number of advancing stocks is outpacing the number of declining stocks, and vice versa for a declining A-D line.
While the S&P 500 rallied to new highs this month, the A-D line failed to keep up. Gains were concentrated in the mega cap components, with five big tech stocks accounting for about 75% of the index’s gains since the October 10 low. The narrow leadership over the last few weeks left the A-D line without a new high, creating a shorter-term divergence between market breadth and price action. While a negative divergence can persist for a prolonged period, the absence of a new high on the A-D line points to some developing short-term structural weakness in the market and introduces risk of a potential false breakout.
Underwhelming Participation in the Latest Rally to Record Highs
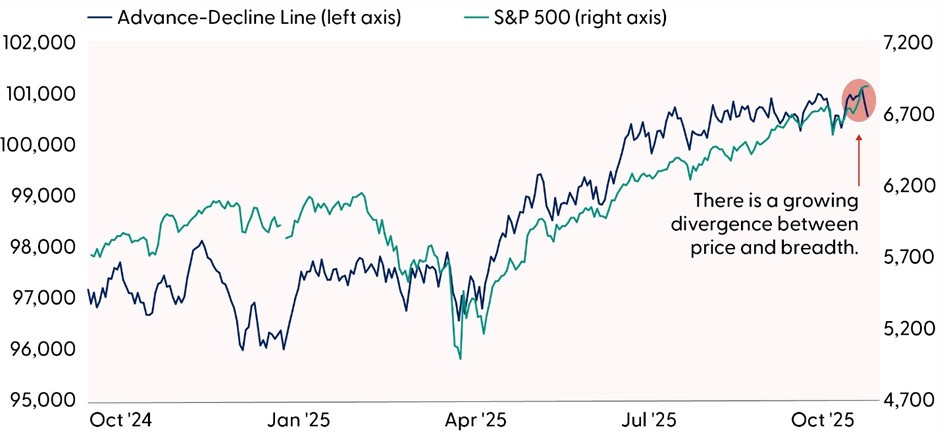
Source: LPL Research, Bloomberg 10/30/25
Disclosures: Past performance is no guarantee of future results. All indexes are unmanaged and can’t be invested in directly.
If this rally does take a breather, seasonal strength could help limit the depth and duration of the drawdown. November has been the best month for stocks over the last 75 years, with the S&P 500 generating an average monthly gain of 1.9% and a 69% win rate. Furthermore, November also kicks off the best six-month return window for stocks. Since 1950, the broader market has posted an average gain of 7.0% from November through May. However, given the strength over the previous six months, it is likely some gains have been pulled forward. Seasonal tendencies also do not always translate into reality, as historical price patterns represent more of the climate than the real-time weather for markets. Economic conditions, earnings, and geopolitics, along with fiscal, monetary, and trade policy, are much bigger drivers of price action.
Conclusion
The October FOMC meeting delivered the widely expected 0.25% rate cut, but the tone was notably less dovish than markets anticipated. While the Fed acknowledged rising risks to the labor market and ended QT earlier than planned, Chair Powell’s comments introduced uncertainty around future rate cuts. The lack of clear forward guidance, combined with growing dissent among policymakers, has reduced visibility and increased volatility risk. Treasury yields rose, stocks pulled back, and rate cut expectations were repriced lower, reflecting a more cautious stance from investors.
Meanwhile, the U.S.–China trade truce has eased tariff pressures, lowering the effective tariff rate and providing a tailwind for corporate earnings. With companies managing margins better than expected, midyear earnings forecasts may have been overly conservative. This shift could support continued earnings strength into year-end, especially if trade tensions remain contained.
However, technical indicators reveal the latest rally has been supported by fewer stocks. The S&P 500’s A-D line failed to confirm recent highs, with gains concentrated in a handful of mega cap stocks. This divergence introduces the risk of a false breakout, particularly if macro headwinds persist. While seasonal strength in November and the historical six-month window from November to May offer support, investors should remain vigilant.
In sum, the macro backdrop is evolving: monetary policy is less predictable, trade risks are easing, and earnings are surprising to the upside. But concentrated leadership and structural cracks in market breadth suggest a more selective and tactical approach may be warranted heading into year-end.
Asset Allocation Insights
LPL’s Strategic and Tactical Asset Allocation Committee (STAAC) maintains its tactical neutral stance on equities. Investors may be well served by bracing for occasional bouts of volatility given how much optimism is reflected in stock valuations, but fundamentals remain broadly supportive. STAAC’s regional preferences across the U.S., developed international, and emerging markets (EM) are aligned with benchmarks. The Committee still favors growth over value, large caps over small caps, and the communication services and financials sectors.
Within fixed income, the STAAC holds a neutral weight in core bonds, with a slight preference for mortgage-backed securities (MBS) over investment-grade corporates. The Committee believes the risk-reward for core bond sectors (U.S. Treasury, agency MBS, investment-grade corporates) is more attractive than plus sectors. The Committee does not believe adding duration (interest rate sensitivity) at current levels is attractive and remains neutral relative to benchmarks.
Important Disclosures
This material is for general information only and is not intended to provide specific advice or recommendations for any individual. There is no assurance that the views or strategies discussed are suitable for all investors or will yield positive outcomes. Investing involves risks including possible loss of principal. Any economic forecasts set forth may not develop as predicted and are subject to change.
References to markets, asset classes, and sectors are generally regarding the corresponding market index. Indexes are unmanaged statistical composites and cannot be invested into directly. Index performance is not indicative of the performance of any investment and do not reflect fees, expenses, or sales charges. All performance referenced is historical and is no guarantee of future results.
Any company names noted herein are for educational purposes only and not an indication of trading intent or a solicitation of their products or services. LPL Financial doesn’t provide research on individual equities.
All information is believed to be from reliable sources; however, LPL Financial makes no representation as to its completeness or accuracy.
All investing involves risk, including possible loss of principal.
US Treasuries may be considered “safe haven” investments but do carry some degree of risk including interest rate, credit, and market risk. Bonds are subject to market and interest rate risk if sold prior to maturity. Bond values will decline as interest rates rise and bonds are subject to availability and change in price.
The Standard & Poor’s 500 Index (S&P500) is a capitalization-weighted index of 500 stocks designed to measure performance of the broad domestic economy through changes in the aggregate market value of 500 stocks representing all major industries.
The PE ratio (price-to-earnings ratio) is a measure of the price paid for a share relative to the annual net income or profit earned by the firm per share. It is a financial ratio used for valuation: a higher PE ratio means that investors are paying more for each unit of net income, so the stock is more expensive compared to one with lower PE ratio.
Earnings per share (EPS) is the portion of a company’s profit allocated to each outstanding share of common stock. EPS serves as an indicator of a company’s profitability. Earnings per share is generally considered to be the single most important variable in determining a share’s price. It is also a major component used to calculate the price-to-earnings valuation ratio.
All index data from FactSet or Bloomberg.
This research material has been prepared by LPL Financial LLC.
Not Insured by FDIC/NCUA or Any Other Government Agency | Not Bank/Credit Union Guaranteed | Not Bank/Credit Union Deposits or Obligations | May Lose Value
For public use.
Member FINRA/SIPC.
RES-0006316-1025 Tracking #819966 | #819967 (Exp. 11/26)