Lower oil “intensity” — less oil used per dollar of economic output — means energy shocks have a smaller impact on growth than in past decades. And from the supply side, the U.S. is now a net exporter of petroleum products. Because we produce more than we import, the economy is less affected by volatile oil prices than during the 1970s and ‘80s, for example.
Despite less reliance on oil, higher oil prices will add pressure to inflation. If energy costs stay elevated, inflation could rise again, potentially delaying interest rate cuts from the Federal Reserve (Fed). Geopolitical uncertainty remains a risk. Conflicts in the Middle East could disrupt supply chains and increase price volatility in key commodities like oil.
U.S. Less Exposed to Oil Shocks
The latest data from the U.S. Energy Information Administration (EIA) shows that the U.S. has firmly established itself as a net exporter of total petroleum products, a shift that first occurred in 2020 and has continued for several years. In 2024 (the latest data from the EIA), U.S. petroleum exports averaged just under 11 million barrels per day, exceeding imports of about 8.4 million barrels per day, marking the fifth consecutive year in which the U.S. held net exporter status. This structural change reflects not only higher domestic production but also the growing role of refined petroleum products and liquids flowing to global markets. As the U.S. continues to expand its export footprint, it becomes less impacted by oil price shocks that have historically weighed on domestic economic performance. For a deeper dive, consult the March Economic Navigator.
Globally, however, not all advanced economies share this strategic position. Japan, in particular, remains acutely exposed to international oil market volatility because it relies on imports to meet over 90% of its crude oil needs, with approximately 88% coming from the Middle East. This heavy dependence puts Japan in a vulnerable position as geopolitical tensions and supply disruptions drive price uncertainty. Oil prices converted to the weakening yen also compound the negative impacts on the Japanese economy. The yen is over 4.5% weaker against the dollar since mid-February. Among the Group of Seven (G7) economies, only Canada and the U.S. are net exporters of petroleum products, while Japan — along with Germany, France, Italy, and the U.K. — remains a net importer and is therefore more sensitive to global price spikes. In the current environment, the U.S. benefits from a partial buffer against oil shocks, while Japan must navigate heightened risk as global energy markets fluctuate.
U.S. Became a Net Exporter of Petroleum Products in 2020
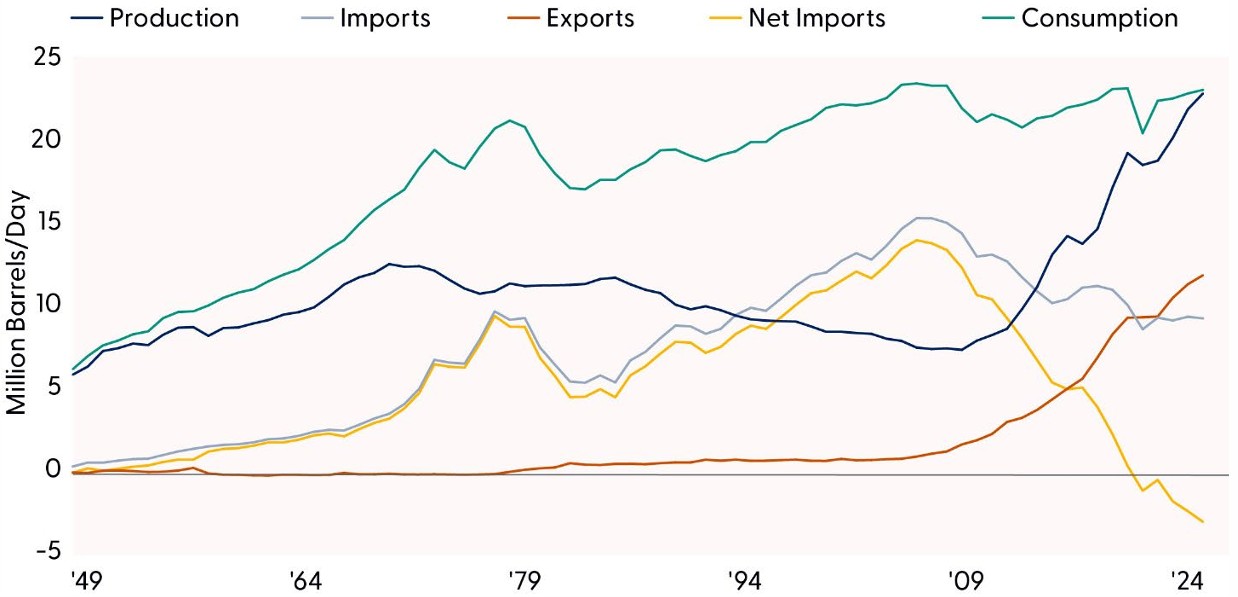
Source: LPL Research, Energy Information Administration, 03/16/26
Disclosures: Past performance is no guarantee of future results.
Transportation Sector Is Dominant User of Oil
Over the past several decades, the structure of U.S. oil demand has shifted dramatically, with the transportation sector emerging as the dominant consumer of petroleum. In the 1950s, transportation accounted for roughly 52% of total oil demand, but by 2024 its share had risen to 67%, reflecting the continued expansion of vehicle use, freight movement, air travel, and the broader mobility needs of a modern economy. Meanwhile, the roles of the residential and commercial sectors have steadily diminished. The residential sector saw its share of oil consumption fall sharply, from about 10% in the 1950s to just 3% in 2024, as households transitioned toward natural gas, electricity, and more efficient heating technologies. These shifts illustrate how oil consumption has become increasingly concentrated in transportation, while improved efficiency and fuel switching have greatly reduced oil use in other sectors. The changing composition of oil consumption may explain why investors have so far shrugged off the blockage at the Strait of Hormuz and the corresponding spike in oil prices.
It may not be just complacency that has buoyed capital markets, but the reality of the domestic economy’s waning reliance on oil.
$200 per Barrel?
A recent article from the American Enterprise Institute detailed the decline in energy usage in the U.S. Despite the likelihood that energy expenditures will increase because of the war in Iran, “the price of a barrel of oil would need to increase to greater than $200 to approach a rate of expenditure consistent with the 5% of GDP of 1980.”1 We are far from that level of oil prices, and investors do not expect prices to reach this level, according to baseline forecasts. This country is much less reliant on foreign energy than it once was, which explains the belief that this oil shock on macroeconomic factors will be short-lived and should not significantly alter the path of growth and core inflation in the longer run if the magnitude and duration of the shock are contained. Federal Reserve research shows the massive spike in Brent crude following Russia’s invasion of Ukraine had minimal impact on growth and core inflation.2
1https://www.aei.org/articles/the-shrinking-economic-weight-of-energy-2/
Transportation Sector Has Increased Share of Petroleum Consumption Over Time
![]()
Source: LPL Research, Energy Information Administration 03/16/26
What Are the Risks to Forecasts?
The most obvious risk to the macro outlook is war in the Middle East and the secondary effects spilling into global logistics, commodity prices, and overall supply chains. Two key factors shaping the outlook amid geopolitical tensions are the magnitude and duration of the shock. Commodity prices would have to stay elevated for at least several weeks for the outlook to materially change. And given the declining oil intensity metrics, oil prices would need to breach $140 per barrel. A more sustained risk to growth in 2026 is the warning signs we have from the job market. Job growth is weakening (demand side), and unemployment remains low (supply side). If labor supply was short, firms would have many more job openings, and push compensation higher, but that is currently not the case. We do expect job growth to deteriorate further. Average monthly gains in 2026 could hover around 50,000 per month. Inflation is another risk. We expect Personal Consumption Expenditures (PCE) inflation to print around 2.2% by December 2026, but the path to that rate will be long and bumpy, especially if Middle East conflicts impact supply chains. If energy prices remain elevated over the coming months, headline inflation may begin to reaccelerate, bringing the Fed to pause for the next several meetings. But as we slowly march toward 2.2% by the end of the year, the Fed will likely cut rates twice later this year.
2The Fed – Oil Price Shocks and Inflation in a DSGE Model of the Global Economy
Trade Headwinds Are Still Lurking in the Background
Headlines are focusing on the risk of war, but when the conflict simmers, the uncertain impacts from trade policy will come back into focus. Investors should remain vigilant, but at least the headwinds are softening.
The reinstated 10% blanket reciprocal tariff under Section 122 of the Trade Act of 1974 marks a notable shift in trade policy, lowering the U.S. effective tariff rate (ETR) to 9.4% from the earlier 12.7% imposed through International Emergency Economic Powers Act (IEEPA) authorities. This reduction stems largely from the retention of prior carve outs, such as those for passenger vehicles, pharmaceuticals, United States-Mexico-Canada Agreement (USMCA) compliant goods, and select electronics, which continue to blunt the impact of tariffs. While the current authorization expires in 150 days without congressional action, the administration retains the ability to raise the levy to a maximum of 15%, a move that would lift the ETR to 11.3%. However, Section 122 does not permit tailor made tariff adjustments by country, limiting the administration’s flexibility even as it increasingly uses tariffs as both a revenue tool and a policy instrument. The administration hopes to make these tariffs permanent using Section 301 which requires investigations of each trading partner and takes several months to complete.
For major trading partners, the updated tariff structure generally results in lower or unchanged ETRs, with no country facing an increase as long as the blanket rate remains at 10%. China, previously subject to dual IEEPA-based tariffs, including a fentanyl-related levy, sees its ETR fall sharply to roughly 19% from 29% under the consolidated approach, though it still retains the highest ETR among large trading partners. Brazil experiences the largest reduction, with its ETR dropping 18 percentage points to 11%, while other significant partners such as Vietnam and Japan also remain among the more highly taxed exporters. Overall, 26 of the United States’ 31 largest trading partners, each with more than $14 billion in imports, benefit from lower effective rates under the new structure, underscoring how the switch from IEEPA to Section 122 redistributes tariff impacts without raising burdens on any country at the current rate.
Tariffs Aren’t Going Away
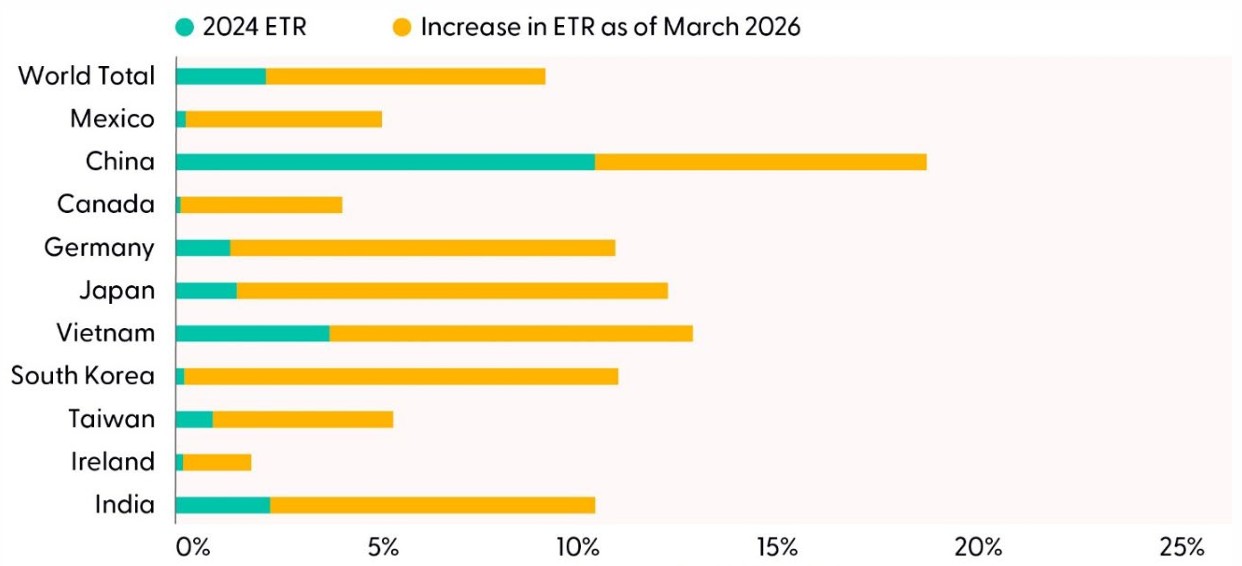
Source: LPL Research, Fitch Ratings, Census Bureau 03/16/26
Asset Allocation Insights
LPL’s Strategic Tactical Asset Allocation Committee (STAAC) maintains its tactical neutral stance on equities. As the war in Iran continues and oil prices have moved sharply higher, investors may be well served by bracing for additional volatility. The stock market’s resilient track record during geopolitical crises is reassuring, leaving STAAC to look for opportunities to potentially add equities at lower levels rather than remove equities due to what will likely be short-term market disruption. Technically, the broad market’s long-term uptrend remains intact.
STAAC’s regional preferences across the U.S., developed international, and emerging markets (EM) are aligned with benchmarks. Attractive valuations in non-U.S. equities are offset by upward pressure in the U.S. dollar, although the Committee continues to watch EM closely for opportunities due to improvements in fundamentals and the technical analysis picture pre-Iran conflict.
The Committee still maintains a slight preference for growth over value tilt and large caps over small caps. In terms of domestic sectors, communication services remains an overweight, while industrials were recently upgraded to overweight based on strong earnings momentum, technical trends, and tailwinds from fiscal spending and AI-driven investment. The Committee continues to debate other upgrade candidates, including healthcare and technology.
Within fixed income, the STAAC holds a neutral weight in core bonds, with a slight preference for mortgage-backed securities (MBS) over investment-grade corporates. The Committee believes the risk-reward for core bond sectors (U.S. Treasury, agency MBS, investment-grade corporates) is more attractive than plus sectors. The Committee does not believe adding duration (interest rate sensitivity) at current levels is attractive and remains neutral relative to benchmarks.
Important Disclosures
This material is for general information only and is not intended to provide specific advice or recommendations for any individual. There is no assurance that the views or strategies discussed are suitable for all investors or will yield positive outcomes. Investing involves risks including possible loss of principal. Any economic forecasts set forth may not develop as predicted and are subject to change.
References to markets, asset classes, and sectors are generally regarding the corresponding market index. Indexes are unmanaged statistical composites and cannot be invested into directly. Index performance is not indicative of the performance of any investment and do not reflect fees, expenses, or sales charges. All performance referenced is historical and is no guarantee of future results.
Any company names noted herein are for educational purposes only and not an indication of trading intent or a solicitation of their products or services. LPL Financial doesn’t provide research on individual equities.
All information is believed to be from reliable sources; however, LPL Financial makes no representation as to its completeness or accuracy.
All investing involves risk, including possible loss of principal.
US Treasuries may be considered “safe haven” investments but do carry some degree of risk including interest rate, credit, and market risk. Bonds are subject to market and interest rate risk if sold prior to maturity. Bond values will decline as interest rates rise and bonds are subject to availability and change in price.
The Standard & Poor’s 500 Index (S&P500) is a capitalization-weighted index of 500 stocks designed to measure performance of the broad domestic economy through changes in the aggregate market value of 500 stocks representing all major industries.
The PE ratio (price-to-earnings ratio) is a measure of the price paid for a share relative to the annual net income or profit earned by the firm per share. It is a financial ratio used for valuation: a higher PE ratio means that investors are paying more for each unit of net income, so the stock is more expensive compared to one with lower PE ratio.
Earnings per share (EPS) is the portion of a company’s profit allocated to each outstanding share of common stock. EPS serves as an indicator of a company’s profitability. Earnings per share is generally considered to be the single most important variable in determining a share’s price. It is also a major component used to calculate the price-to-earnings valuation ratio.
All index data from FactSet or Bloomberg.
This research material has been prepared by LPL Financial LLC.
Not Insured by FDIC/NCUA or Any Other Government Agency | Not Bank/Credit Union Guaranteed | Not Bank/Credit Union Deposits or Obligations | May Lose Value
For public use.
Member FINRA/SIPC.
RES-0006767-0226 Tracking #1078433 | #1078434 (Exp. 03/2027)