The term stagflation has been circulating increasingly in the financial media as inflation readings have risen sharply in recent months. The term is often associated with the 1970s, which saw runaway inflation—largely driven by sky-high energy prices—and lackluster economic growth. Stagflation and a return to the weak equity markets of the 1970s would be understandably scary. However, when looking at the data, we remain skeptical that either runaway inflation or low growth are right around the corner, much less both at the same time.
The Misery Index
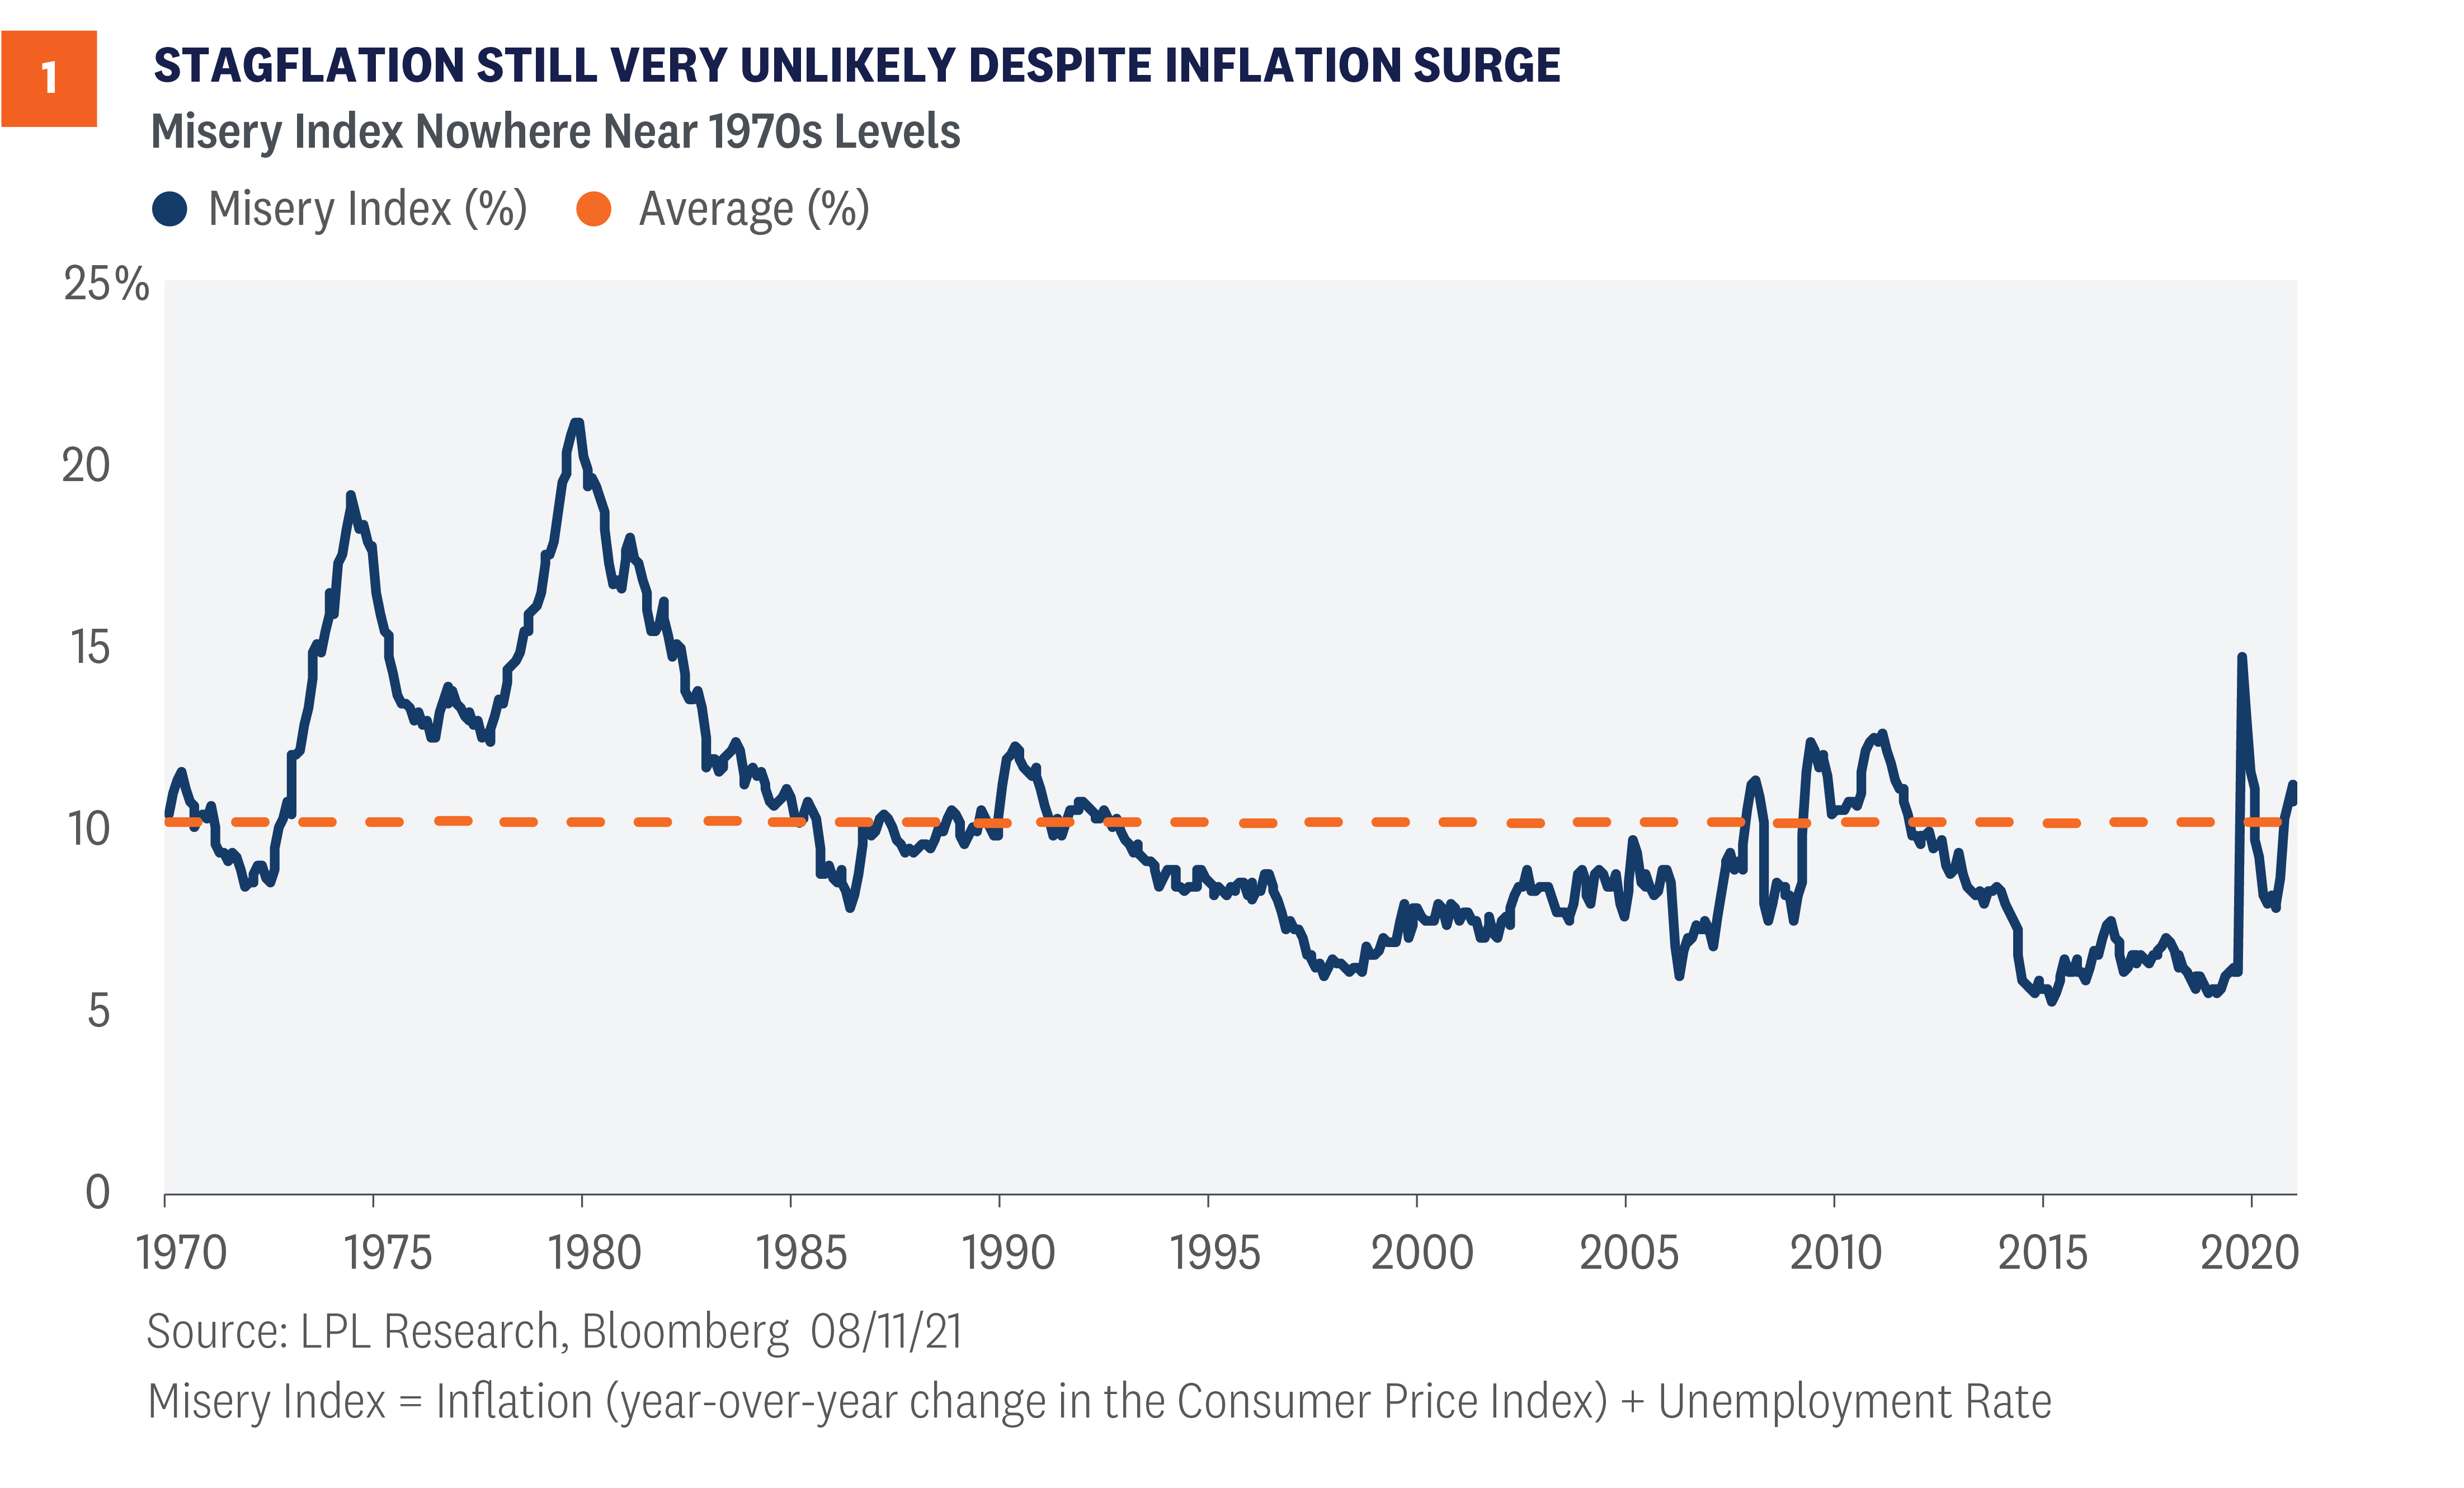
One way to gauge stagflation is to calculate what is commonly referred to as the Misery Index—inflation plus unemployment. As shown in [Figure 1], the Misery Index today is nowhere near the extreme levels of the 1970s. In fact, the level of “misery” is very close to the long-term average near 10—despite the highest inflation readings we’ve seen in over a decade.
“We don’t believe the current environment is anything like the stagflation experiences of the 1970s,” explained LPL Financial Director of Research Marc Zabicki. “We think much of the elevated inflation readings we’re seeing now are transitory and related to pandemic bottlenecks and material shortages. Meanwhile, the economic reopening and massive stimulus should provide a strong one-two punch to keep economic growth well above average through 2022.”
Price Competition Anchors Inflation
The irony of inflation concerns is that the Federal Reserve has been trying, without success, for the past decade to stimulate inflation to its 2% long-term target. We believe there are several structural considerations at play that have—and will continue to—put downward pressure on prices over the medium- to long-term.
Demographics and global trade are two of those considerations. We also believe that more acute price competition is an important variable that can keep prices contained. In our view, the ubiquitous use of the internet has indeed raised the price consciousness of the consumer. It has streamlined the price discovery process and has served to shift the pricing balance of power from producers to consumers. After all, consumers can sift through products, services, and their pricing on their smartphones without leaving their home. Just a decade ago, what consumers could purchase on the internet may have been limited to small-ticket commodity items, electronics, and books. Now the list of goods and services for which consumers can comparison shop includes nearly everything from new vehicles to airline tickets to homes to rent or buy.
In this context, it is little surprise to us that inflation has been benign for years, and we anticipate price pressures could again subside once coronavirus-related supply/demand imbalances run their course.
Market Inflation Expectations Peaked In May
Much of the runaway inflation case had centered on skyrocketing commodity prices, a valid concern to be sure. However, since May nearly every commodity that was causing alarm has seen a significant decline. Lumber prices? Down more than 70%. Copper prices? Down 15%. Even crop prices such as corn and soybeans have fallen significantly over the past few months. As they often say, the cure for high prices is high prices.
We also take comfort in the fact that the bond market actually agrees with our view of transitory inflation. If one was simply looking at recent economic reports or reading media headlines, they might be surprised to realize that the market isn’t actually looking for more extreme inflation readings.
By looking at the difference between what bond traders pay for inflation-protected Treasuries and plain vanilla nominal Treasuries, we can get a good idea of what the market’s expectations for inflation actually are. Market-implied inflation expectations or “breakevens” rose rapidly from extremely low levels last year. However, a funny thing happened after the release of the April Consumer Price Index (CPI) report in early May: Inflation expectations actually fell. And those expectations have continued to fall despite higher subsequent readings. Currently, market participants are estimating inflation to be less than 2.5% annualized over the next five years, more than 30 basis points (0.30%) lower than the expectation in early May.
Growth Outlook is Favorable
The other key component of the Misery Index is the unemployment rate, a sort of proxy for growth and economic health. The unemployment rate is not yet back to its pre-pandemic levels, but the most recent jobs report showed that the economy added nearly a million jobs in July, bringing the unemployment rate down to 5.4%. We see the potential for further job gains as schools reopen and unemployment benefits expire for a significant amount of the unemployed in early September.
That said, after the boosts from the reopening and stimulus pass, the U.S. economy may resume its pre-pandemic growth trend in the neighborhood of 2% real gross domestic product (GDP) growth. Bloomberg’s survey of economists points to just 2.3% real GDP growth in 2023, after 4.2% next year. Given the limited population growth in the United States, demographic headwinds as baby boomers retire, and low immigration rates, the opportunity for stronger economic growth than that may be limited, and that slower growth makes higher inflation all the less likely.
Conclusion
Stagflation is understandably a concern. Low growth and high inflation lead to a situation where the vast majority of people become poorer in real terms. However, we simply do not believe the evidence indicates this to be a likely scenario. While prices are not likely to outright decline and create deflation, we expect recent inflation readings to moderate and growth to remain at a solid speed over the next year. We believe this helps bolster the case for stocks to add to gains through the remainder of 2021.
Click here to download a PDF of this report.
IMPORTANT DISCLOSURES
This material is for general information only and is not intended to provide specific advice or recommendations for any individual. There is no assurance that the views or strategies discussed are suitable for all investors or will yield positive outcomes. Investing involves risks including possible loss of principal. Any economic forecasts set forth may not develop as predicted and are subject to change.
References to markets, asset classes, and sectors are generally regarding the corresponding market index. Indexes are unmanaged statistical composites and cannot be invested into directly. Index performance is not indicative of the performance of any investment and do not reflect fees, expenses, or sales charges. All performance referenced is historical and is no guarantee of future results.
Any company names noted herein are for educational purposes only and not an indication of trading intent or a solicitation of their products or services. LPL Financial doesn’t provide research on individual equities.
All information is believed to be from reliable sources; however, LPL Financial makes no representation as to its completeness or accuracy.
U.S. Treasuries may be considered “safe haven” investments but do carry some degree of risk including interest rate, credit, and market risk. Bonds are subject to market and interest rate risk if sold prior to maturity. Bond values will decline as interest rates rise and bonds are subject to availability and change in price.
The Standard & Poor’s 500 Index (S&P500) is a capitalization-weighted index of 500 stocks designed to measure performance of the broad domestic economy through changes in the aggregate market value of 500 stocks representing all major industries.
The PE ratio (price-to-earnings ratio) is a measure of the price paid for a share relative to the annual net income or profit earned by the firm per share. It is a financial ratio used for valuation: a higher PE ratio means that investors are paying more for each unit of net income, so the stock is more expensive compared to one with lower PE ratio.
Earnings per share (EPS) is the portion of a company’s profit allocated to each outstanding share of common stock. EPS serves as an indicator of a company’s profitability. Earnings per share is generally considered to be the single most important variable in determining a share’s price. It is also a major component used to calculate the price-to-earnings valuation ratio.
All index data from FactSet.
Please read the full Midyear Outlook 2021: Picking Up Speed publication for additional description and disclosure.
This research material has been prepared by LPL Financial LLC.
Securities and advisory services offered through LPL Financial (LPL), a registered investment advisor and broker-dealer (member FINRA/SIPC). Insurance products are offered through LPL or its licensed affiliates. To the extent you are receiving investment advice from a separately registered independent investment advisor that is not an LPL affiliate, please note LPL makes no representation with respect to such entity.
Not Insured by FDIC/NCUA or Any Other Government Agency | Not Bank/Credit Union Guaranteed | Not Bank/Credit Union Deposits or Obligations | May Lose Value
RES-867001-0821 | For Public Use | Tracking # 1-05181664 (Exp. 08/22)